The Expense Report shows you how much you are spending, broken down by category and by period. Enable the profit summary to compare your expenses against revenue and see your net profit over any date range.
Opening the report
- 1
Go to Reports
Click Reports in the left sidebar, then click "Expense Report".
Setting the date range and period
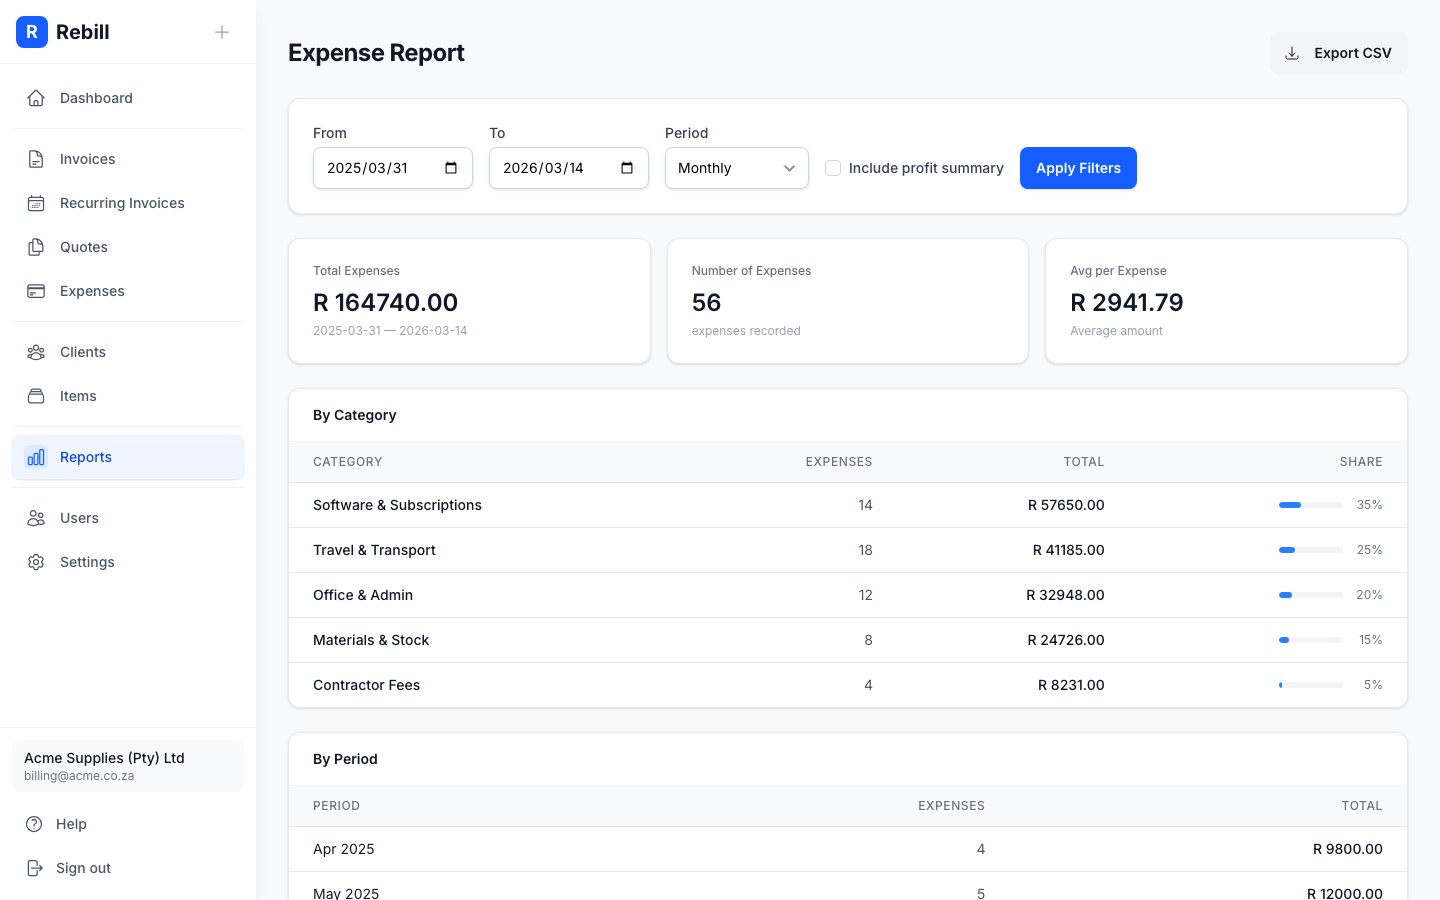
At the top of the report, use the Filters section to set:
- From and To dates: the period you want to analyse
- Period: whether to group data by Month, Quarter, or Year
- Include profit summary: tick this to add a Net Profit card comparing your revenue against expenses
Click "Apply Filters" to update the report.
Reading the report
Three summary cards appear at the top:
- Total Expenses: the total amount spent in the selected period
- Number of Expenses: how many expense records were logged
- Avg per Expense (or Net Profit if profit summary is enabled): the average amount per expense, or your revenue minus expenses for the period
Below the cards, two tables break down your spending:
- By Category: each expense category with its total, count, and share of total spending shown as a progress bar
- By Period: spending grouped by the period you selected (monthly, quarterly, or yearly)
Exporting to CSV
Click "Export CSV" at the top right to download the category breakdown as a spreadsheet. This is useful for sharing with your accountant.